|
Windows / Series Editing Windows-Creating/Editing Series |
RATS displays a Series Editing Window when you use the DEDIT and EDIT instructions to create or edit a series on a RATS format file, double-click on a series shown in a RATS Data File Window, double-click on a series in the Series Window, or select the View>Create Series (Data Editor) operation. These are used to create or edit series. A sample series edit window is shown below:
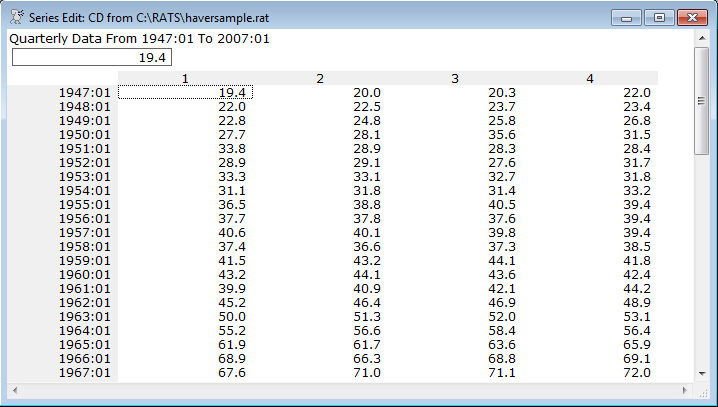
Top Display
The series name appears in the title bar of the window. The frequency and date range information for the series appear at the top of the window (these are automatically updated when you add or delete entries).
Below this is the input cell, which displays either the current value of the highlighted cell, or the value you are currently editing.
The rest of the window is used to display the data for the series, with the data organized in rows and columns. Read the data like you do lines of text, moving from left to right, top to bottom. Dates or entry numbers are displayed at the left of the screen. The date or entry refers to the first data point in that row.
Moving Around and Selecting Cells
You can move around the table by clicking on a cell with the mouse, or by using the arrow keys, <PgUp>, <PgDn>, <Home>, <End>. Moving to a cell or clicking on a cell "selects" that cell, and you will see the value of that cell displayed in the input cell at the top of the window.
Editing a Cell
To enter a new value in an existing cell, just select (highlight) the cell as described above and start typing in the new number. The numbers you type will appear in the input cell at the top of the window. Hitting <Enter> or moving the focus to a different cell will copy this value to the worksheet. Hit <Esc> to cancel the editing.
To edit, rather than replace, the existing value in a cell, just select the cell, and then click anywhere in the input cell. You can type in new numbers or use <Backspace> and <Delete> to delete characters. Use the mouse or the arrow keys and <Home> and <End> to move back and forth in the input cell. Hit <Enter> (or select a different cell) to copy this value to the worksheet. Hit <Esc> to cancel without copying changes to the worksheet.
Adding New Entries
To add a new entry to the end (or beginning) of a series, go to the end (or beginning) of the series and move one space to the right (or left) with the arrow keys. This creates a new cell containing the "NA" missing value code. You can then type in a new value for the cell. Note that you must enter a value for the new entry before you can add any additional entries. You can also add a cell to the end of a series by clicking on the "empty" location with the mouse.
Copy
The selected data are copied for pasting into another application. The information is copied out as plain text, as a DIF file (text spreadsheet) and as a spreadsheet content. You might need to choose "Paste Special" in the target application. DIF will have greater precision (if available).
Paste
You can paste numerical information into an editing window from either a text or spreadsheet source. It will be inserted at the currently selected position in the edit window, with new entries added if necessary. Note that, while the edit window displays the information in a "table", the data are actually treated as a single stream of data running first across, then down. So data that come in are pasted in the same order. If, for instance, you copy a 10 row x 12 column table out of a spreadsheet (not uncommon for a display of monthly data), the first row of the copied data will be used for the next 12 values in the edit window, then the second row will be used for the next 12 values, etc.
When using a Series Edit Window, you can change the way the data appear on the screen using the menu operation View>Change Layout or the toolbar icon ![]() . This brings up the dialog:
. This brings up the dialog:
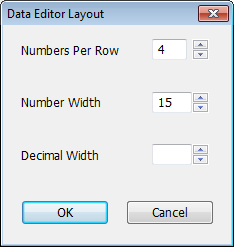
The main value of changing the Numbers Per Row is to match the view of the data to your original source if you need to double-check numbers that you have had to type in. The most common change in the layout is to adjust the decimal digits. By default, the data editor uses the shortest representation that can display all the data. That works well with original source data with a limited number of digits (like the sample above). However, with data that have been through some transformations (such as logs or averages), you might get ten (or even more) decimals. Number Width allows you to change the overall width of the numbers—the representation will be adjusted so as to display all the data in fields of that width. Decimal Width directly resets the number of digits displayed right of the decimal. Click on “OK” to close the Change Layout dialog box and apply your changes.
To Quit Editing
To finish editing a series, just close the window (see Closing Windows). If you have made any changes to the series, RATS will ask if you want to save the changes. Choose "Yes" to save the changes, "No" to close without saving, or "Cancel" to abort the close operation and continue editing the series.
IMPORTANT NOTE: When editing series stored on RATS data files, changes won't be saved to the file until you issue a SAVE instruction after closing the window. However, if you close the RATS file or quit RATS without saving your changes, RATS will give you an opportunity to save your changes before it closes the file.
Toolbar
|
|
Shortcut for Edit>Select All. |
|
|
Shortcut for View>Change Layout. See the description above. |
|
|
Shortcut for File>Print. |
|
|
Shortcut for Edit>Copy. See the description above. |
|
|
Shortcut for Edit>Paste. See the description above. |
|
|
Inserts a new cell at the current cursor position (cell value is set to NA). |
|
|
Removes the current cell and shifts the remaining data one position to the left to fill its place. |
|
|
Sets the current cell to the missing value code (NA, or Not Available). |
|
|
Shortcut for Edit>Undo. Undoes the last edit |
|
|
Shortcut for Edit>Redo. Redoes the last edit |
|
|
Moves the cursor to the cell containing the largest (maximum) value in the series. |
|
|
Moves the cursor to the cell containing the smallest (minimum) value in the series. |
|
|
Shortcut for Edit>Find. Searches for an (exact) value. |
|
|
Shortcut for View>Statistics. Displays a Report Window with basic statistics (mean, variance, skewness, etc.) for the series. |
|
|
Shortcut for View>Time Series Graph. Displays a time series graph for the series. |
|
|
Shortcut for View>Histogram. Displays a histogram plot for the series. |
|
|
Displays a time series graph with several power transformations of the series. |
Copyright © 2026 Thomas A. Doan