|
Graphics / Fan Charts |
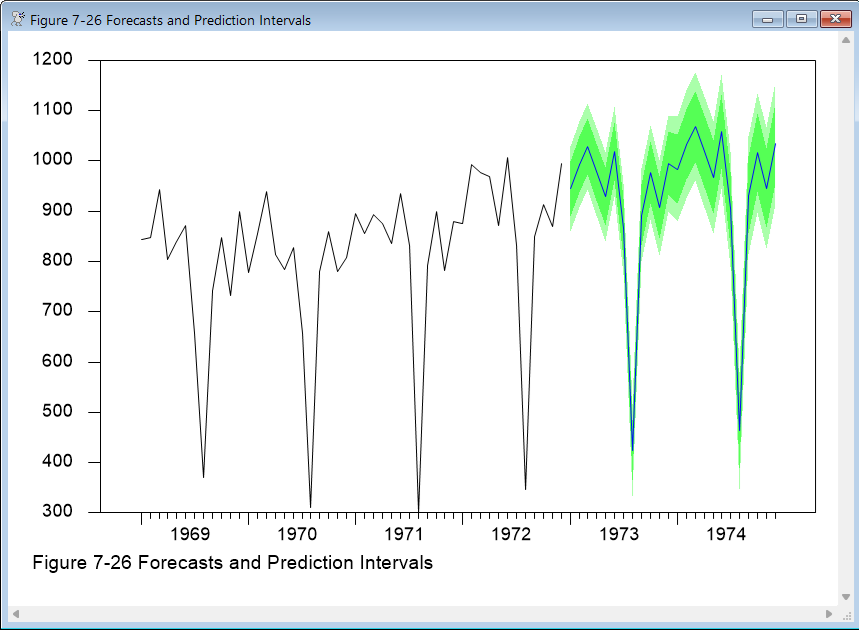
Fan charts provide a useful way to display confidence bands, particularly with multiple levels. The confidence bands are displayed in shades of the same color, which are darkest nearest the center and growth fainter towards the outer bands. With the GRAPH instruction, it’s usually best to do these as an overlay, with the point forecast being done as a line. Make sure that you use OVSAME with OVERLAY=FAN so the bands are located in the correct location.
This is from Makradakis, et. al (1998), part of textbook example MWH3P366.RPF. It computes point forecasts and upper and lower 80% and 95% confidence bands. The pre-forecast data and the point forecasts are done as line graphs; the confidence bands as an overlay. The order of listing of the series covered by the fan isn’t important: at each point, the values are ordered from bottom to top. With four series, there are three bands. The center is done in a darker color (gray for black and white) and the outer ones in a lighter shade.
uforecast(equation=weq,stderrs=stderrs) wfore 1973:1 1974:12
set lower95 1973:1 1974:12 = wfore+%invnormal(.025)*stderrs
set upper95 1973:1 1974:12 = wfore+%invnormal(.975)*stderrs
set lower80 1973:1 1974:12 = wfore+%invnormal(.1)*stderrs
set upper80 1973:1 1974:12 = wfore+%invnormal(.9)*stderrs
graph(footer="Figure 7-26 Forecasts and Prediction Intervals",ovcount=4,overlay=fan,ovsame) 6
# writing 1969:1 1972:12
# wfore
# lower95
# lower80
# upper80
# upper95
Copyright © 2026 Thomas A. Doan