CUMPDGM Procedure |
Performs a Durbin's Cumulated Periodogram test for serial correlation. The test statistic is a Kolmogorov-Smirnov statistic.
@CUMPDGM( options ) series start end
Parameters
|
series |
series to test |
|
start, end |
range over which to run the test. By default, the range of series |
Options
[PRINT]/NOPRINT
[GRAPH]/NOGRAPH
Example
calendar(q) 1947:1
open data haversample.rat
data(format=rats) 1947:1 2006:4 gdp
*
log gdp
diff gdp / diffgdp
diff(center) diffgdp
@cumpdgm diffgdp
This tests the de-mean log difference of GDP for serial correlation. If the series were a drifting random walk, this would show an insignificant test.
Sample Output
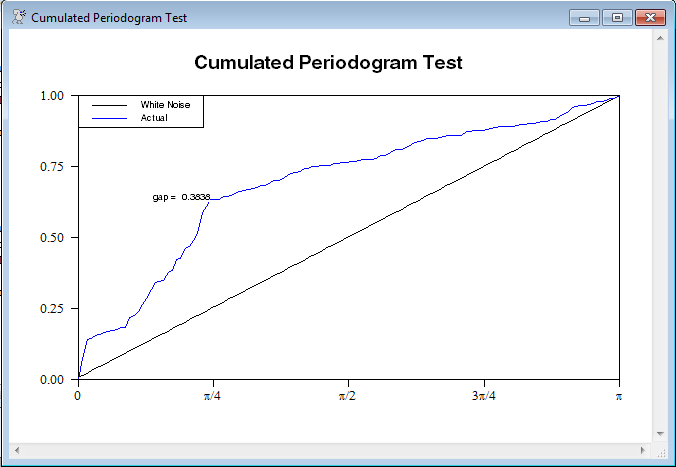
This is the output from the example above. The test statistic is well outside the rejection level. The graph shows a 45 degree line, which is where the blue line should be (roughly) if the series were white noise. Instead, it's fairly clear that the lower frequencies are more dominant than the higher ones.
Cumulated Periodogram Test for Series DIFFGDP
Maximum Gap 0.3838
At Frequency 0.7854
Approximate Rejection Limits
1% 0.1441
5% 0.1202
1% 0.1078
Copyright © 2026 Thomas A. Doan